

Economic Geography - Lab 5: Locational Indices
Locational Indices: Dissimilarity, Segregation and the Lorenz Curve
The purpose of this exercise is to introduce students to the several locational indices, the Index of Dissimilarity, the Index of Segregation, the Gini Coefficient, and the graphical devices frequently used to show distributional inequality, the the Lorenz Curve.
These measures can be used for a variety of purposes, wherever you want to measure inequality. Frequently such measures are used to describe patterns of ethnic segregation, but they can also be used to measure income inequality, market shares, traffic patterns at ports, or interchanges, etc.
Index of Dissimilarity

Where:
- ID = Index of Dissimilarity
- Xi= Number of apples at place i
- Yi= Number of oranges at place i
- * note that the bars "| |" surrounding the numerator tell you to take the absolute value (e.g. =abs in Microsoft Excel)
OR
Where:
- X, = the fraction of apples at place i
- Yi = the fraction of oranges at place i
- N = the number of all observations/things
One would use the index of dissimilarity to compare the distribution of two different categories of persons or things. An index value of 0 indicates perfectly proportionate distribution. An index value of 100 indicates the opposite spatial distribution. This appears to be used more to measure ethnic segregation (oddly enough) because you would use one group of people as apples and others as oranges. Clearly though this formula could be used for two competing types of businesses (liquor store vs. health food stores; banks and payday lenders; etc.)
Index of Segregation (Concentration)
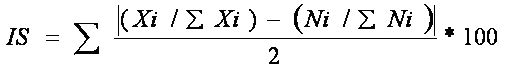
Where:
- IS = Index of Segregation
- Xi= Number of red apples at place i
- Ni= Number of all apples at place i
* note that the bars "| |" surrounding the numerator tell you to take the absolute value (e.g. =abs )
This formula is only very slightly different than the one above. It appears that this formula is more commonly used to measure the concentration of an event/characteristic at a group of locations.
One would use the index of segregation to compare the distribution of a subcategory within a larger category of persons or things. An index value of 0 indicates perfectly proportionate distribution. An index value of 100 indicates the opposite spatial distribution.
Gini Coefficient
The Gini Coefficient is a measure of inequality closely related to the measures above. It is most frequently used to measure income inequality among classes of people grouped by their wealth, but can also be used to measure other concentrations of activity by comparing "perfect" distribution against the reality of distribution.
Here's an interesting link to another step-by-step tutorial:http://www.ncat.edu/~burkeym/Gini.htm
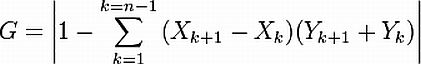 Where:
- Xk = the cumulative percentage of X at observation k
- Yk = the cumulative percentage of Y at observation k
- k+1 = the subsequent observation
Adapted from : http://people.hofstra.edu/geotrans/eng/ch4en/meth4en/ch4m1en.html
Use with some caution. I'm not convinced that they didn't fudge on their calculations a bit (switching X's and Y) in their interactive page, but nevertheless it is well done.
Here's an alternative sample of their work done in Excel
Lorenz Curve
The Lorenz Curve is a graphical representation of the preceding formulas. The accompanying Microsoft Excel file has a hypothetical application of the Lorenz Curve. Consult it to best understand how to make a Lorenz curve, or follow the directions below
- Highlight your data, including the column headings from the first column to the last column of cumlative shares.
- Click on the Chart Wizard Icon
- Pick either the two line or area option.
- From the "Series" tab, remove the series that you do not want to graph, leaving only the two cumlative series. One must be a straight linear progression.
- Change the cosmetic nature of the graph to suit your purposes.
These are your tasks:
- Open this census data file for Wayne County, Michigan. This file provides counts of people by their ethnicity for Detroit arranged by census tract.
- This one is raw data for Wayne County ---- This file has the calculations for Wayne County
- Review the formulas and note the manner in which the graphics appear.
- Go to the census bureau and download the P3 data from the 2000 census for Orange County.
- Replicate the calculations in the Wayne County file for Orange County.
- Send the file as an attachment via email to Dr. Graves.
