CSUN-related expenditures during the 2013/2014 academic year supported an estimated 10,369 full-time equivalent jobs throughout Los Angeles County and an additional 1,405 jobs statewide, for a total of 11,774 jobs. Of these, roughly 7,400 represent jobs directly supported by CSUN, approximately 2,074 positions are supported through indirect effects, and 2,300 are supported through induced effects. Given the significant level of direct expenditures by CSUN, the bulk of job creation (46%) is in the Private Junior Colleges, Colleges, Universities, and Professional Schools sector. Notably, a significant proportion (37.1%) of the total statewide jobs created come from secondary impacts and span a wide range of industries.
With capital expenditures being put toward new construction activities at CSUN, the Construction sector has also benefited, accounting for 9.1% of the total employment-creation impact throughout the entire state. All job creation in this sector is anticipated to occur within Los Angeles County.
| Table 8: Employment Impact of CSUN Expenditures | ||||
|---|---|---|---|---|
| Impact | Local | County | State | Total |
| Direct | 6,068 | 1,332 | 0 | 7,400 |
| Indirect | 1,002 | 220 | 852 | 2,074 |
| Induced | 1,433 | 315 | 553 | 2,300 |
| Total | 8,503 | 1,866 | 1,405 | 11,774 |
| Source: IMPLAN, with calculations by Beacon Economics | ||||
The Real Estate Establishments sector received the largest secondary benefit (indirect and induced jobs only), accounting for 9.0% of the statewide secondary jobs impact. The Food Services and Drinking Places sector also benefited, accounting for 7.3% of the statewide secondary employment impact. With CSUN’s heavy reliance on vendors (for equipment, supplies, etc.), the Wholesale Trade Business sector also experienced a significant jobs benefit, mainly through direct employment. Overall, this sector accounted for 6.5% of the total state employment impact and 4.2% of the statewide secondary employment impact.
| Table 9: Top 10 Total Employment Impacts by Industry (Jobs) | ||||
|---|---|---|---|---|
| Industry | Local Output | County Output | ||
| Educational Services | 4,511 | 990 | ||
| Construction | 880 | 193 | ||
| Wholesale Trade | 580 | 127 | ||
| Professional Services | 520 | 86 | ||
| Retail | 277 | 61 | ||
| Healthcare | 225 | 60 | ||
| Food Services and Drinking Places | 204 | 45 | ||
| Financial Services | 176 | 50 | ||
| Real Estate | 176 | 39 | ||
| Manufacturing | 53 | 22 | ||
| Source: IMPLAN, with calculations by Beacon Economics | ||||

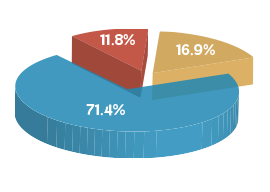
- Direct Impact
- Indirect Impact
- Induced Impact
Figure 7- Local Impact of CSUN Expenditures on Output

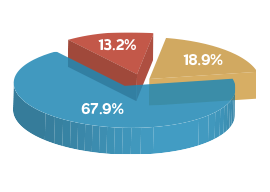
- Direct Impact
- Indirect Impact
- Induced Impact
Figure 8- State Impact of CSUN Expenditures on Output

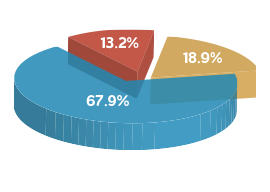
- Direct Impact
- Indirect Impact
- Induced Impact
Figure 9- County Impact of CSUN Expenditures on Output

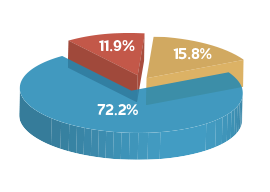
- Direct Impact
- Indirect Impact
- Induced Impact

