December 15, 2022
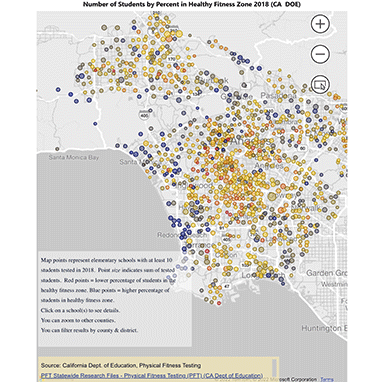
Childhood Fitness Dashboard - Dr. Steve Graves
Click the image above or visit https://app.powerbi.com/view?r=eyJrIjoiMzVhZTExZmQtYzJjOS00YzBkLTgxYjMtZTFiMGZjYWIwYWY2IiwidCI6IjdmZjE1NTIyLTYwOTYtNDdkYy04OWJmLTM4OWJiZTEzY2Q2OCIsImMiOjZ9&fbclid=IwAR1ibIQ77J1yI73ggh4Ei5KkXNAT-S-c_QLWDcNwoem2mlqPAy_At35xyAM to view the interactive map.
Dr. Steve Graves, a professor from the geography department and one of the HERE Center’s faculty partners, recently created a dashboard showcasing childhood fitness levels within Los Angeles!
This dashboard contains visualizations of data gathered by physical education instructors from around the state in 2017-2018. Each year students in 5th grade are asked to complete a series of physical fitness tests, and the results are reported to the California Department of Education each year. This dashboard reports on only Aerobic Capacity and Body Composition.
The data has been downloaded and combined with a map of schools to provide a tool to allow researchers and stakeholders to quickly compare metrics regarding schools, and students grouped by ethnicity, gender, and income.
Results for schools with fewer than 10 tested students, or fewer than 10 tested students in any category, are not reported for privacy reasons.
Data filters allow users to select specific counties, school districts, ethnicities, gender, and income categories.
Users can select multiple schools by holding down the control key and clicking on various schools, or by using the multi-select tool. Your mouse allows you to zoom and pan to specific regions or neighborhoods.


