Activity 19.1.3 – Discovering family similarities
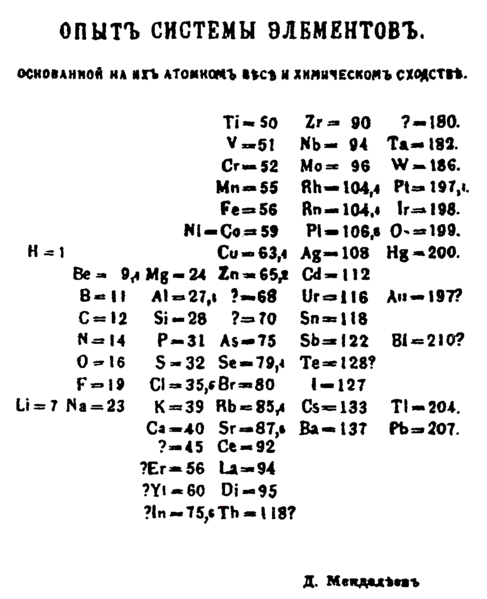
 Dimitri Mendeleev, a Russian chemist, created the first version of the Periodic Table of the Elements (figure 19.3) in 1869. When he ordered the elements according to increasing atomic weight in columns so that rows contained analogous elements, he saw patterns that allowed him to predict the properties of elements yet to be discovered. Mendeleev’s task was formidable because there was relatively little data to work with, and no electronic tools to organize it. Today, however, we have an abundance of information as well as database tools that allow us to instantly group data by common characteristics. Database technology has fueled the Information Revolution by allowing us to store and examine large amounts of data. In this activity you will use a database program to separate data by groups and summarize your findings.
Table 19.2 (see book) arranges the elements in terms of increasing atomic number. No patterns or trends are seen when the elements are displayed in this fashion. If, however, elements are arranged as seen in the periodic table, those with similar properties are grouped together. Each column represents a family of elements that have similar electron configuration and similar chemical properties. Although the periodic table makes it easy to see which elements have similar properties (those in the same family or column), it does not allow for an easy comparison of these properties. By contrast, table 19.2 lists much specific information about the properties of the elements, but does not allow for comparison of family (group) data, unless first arranged by group.
Sort the elements by group, then calculate average group values for heat of fusion, specific heat, thermal conductivity, and other properties of your choice using the subtotal command and average option. List your results. Database.
(1) Which families are most similar to each other?
(2) Which families are most dissimilar to each other?
