

Analysis of Exisiting Cluster Monitoring Systems
In total six systems were researched, of which the focus was on Ganglia, PLMSys and the HPC system:
- Ganglia [1]: Ganglia is a monitoring system for high performance computing, which was designed and implemented by students from the university of Berkeley California. Ganglia’s main functions are carried out by two types of daemons called gmond and gmetad. The gmond daemons are deployed in each of the computer systems being monitored to collecting metrics such as CPU usage, workload, network usage, memory usage, and more. Gmtad collects the metrics information from any node and saves it in a RRD database. PHP scripts then extract the information from the RRD and sent sent it to an apache server that converts the data into a webpage and makes the graphs dynamically for a user to interact with them.
- PLMSys [2]: Its main job is to complement the existing monitoring systems as well as helping users and businesses monitor clusters and docker containers. It works via the following modules: The metrics acquisition module is installed on each host to gather data on its metrics as well as the metrics of the docker containers. This data ultimately ends in a monitoring database for storage. The container logging module retrieves the logs that docker stores from each container and organizes and sends them to the monitoring database for ‘centralized preservation’. The exception alerting module can be modified/set according to preference to alert for anomalies. The workload analysis module uses the time series model to provide descriptive statistics of the metrics retrieved from the containers and hosts. The PLMSys monitor system manages data transfer through the message querying system for increased efficiency and performance and uses OpenTSDB and MySQL to store performance metrics, data logs and platform settings.
- HPC Monitoring System [3]: Four-tiered architecture, starts with the grid information detecting layer which obtains information from system’s daemons about memory usage, network traffic and more. Next in the Grid information Management layer, a shell program gathers all the data and passes it to a multicast channel that transmits periodic statuses of the nodes and keeps itself updated through listening threads. In the cluster information gateway layer, data is collected from nodes but combined in a “single cluster image” then pass back to layer 2. This layer also performs the function of transforming all data obtained into standard format that conforms to XLM format. Finally, in the cluster information interface layer users/administrators can engage with an easy-to-use user interface.
- Install Apache web server on the server node
- Install PHP modules on the server node
- Install Ganglia gmond and gmetad daemons on the server node
- Install Ganglia gmond daemon on the client nodes
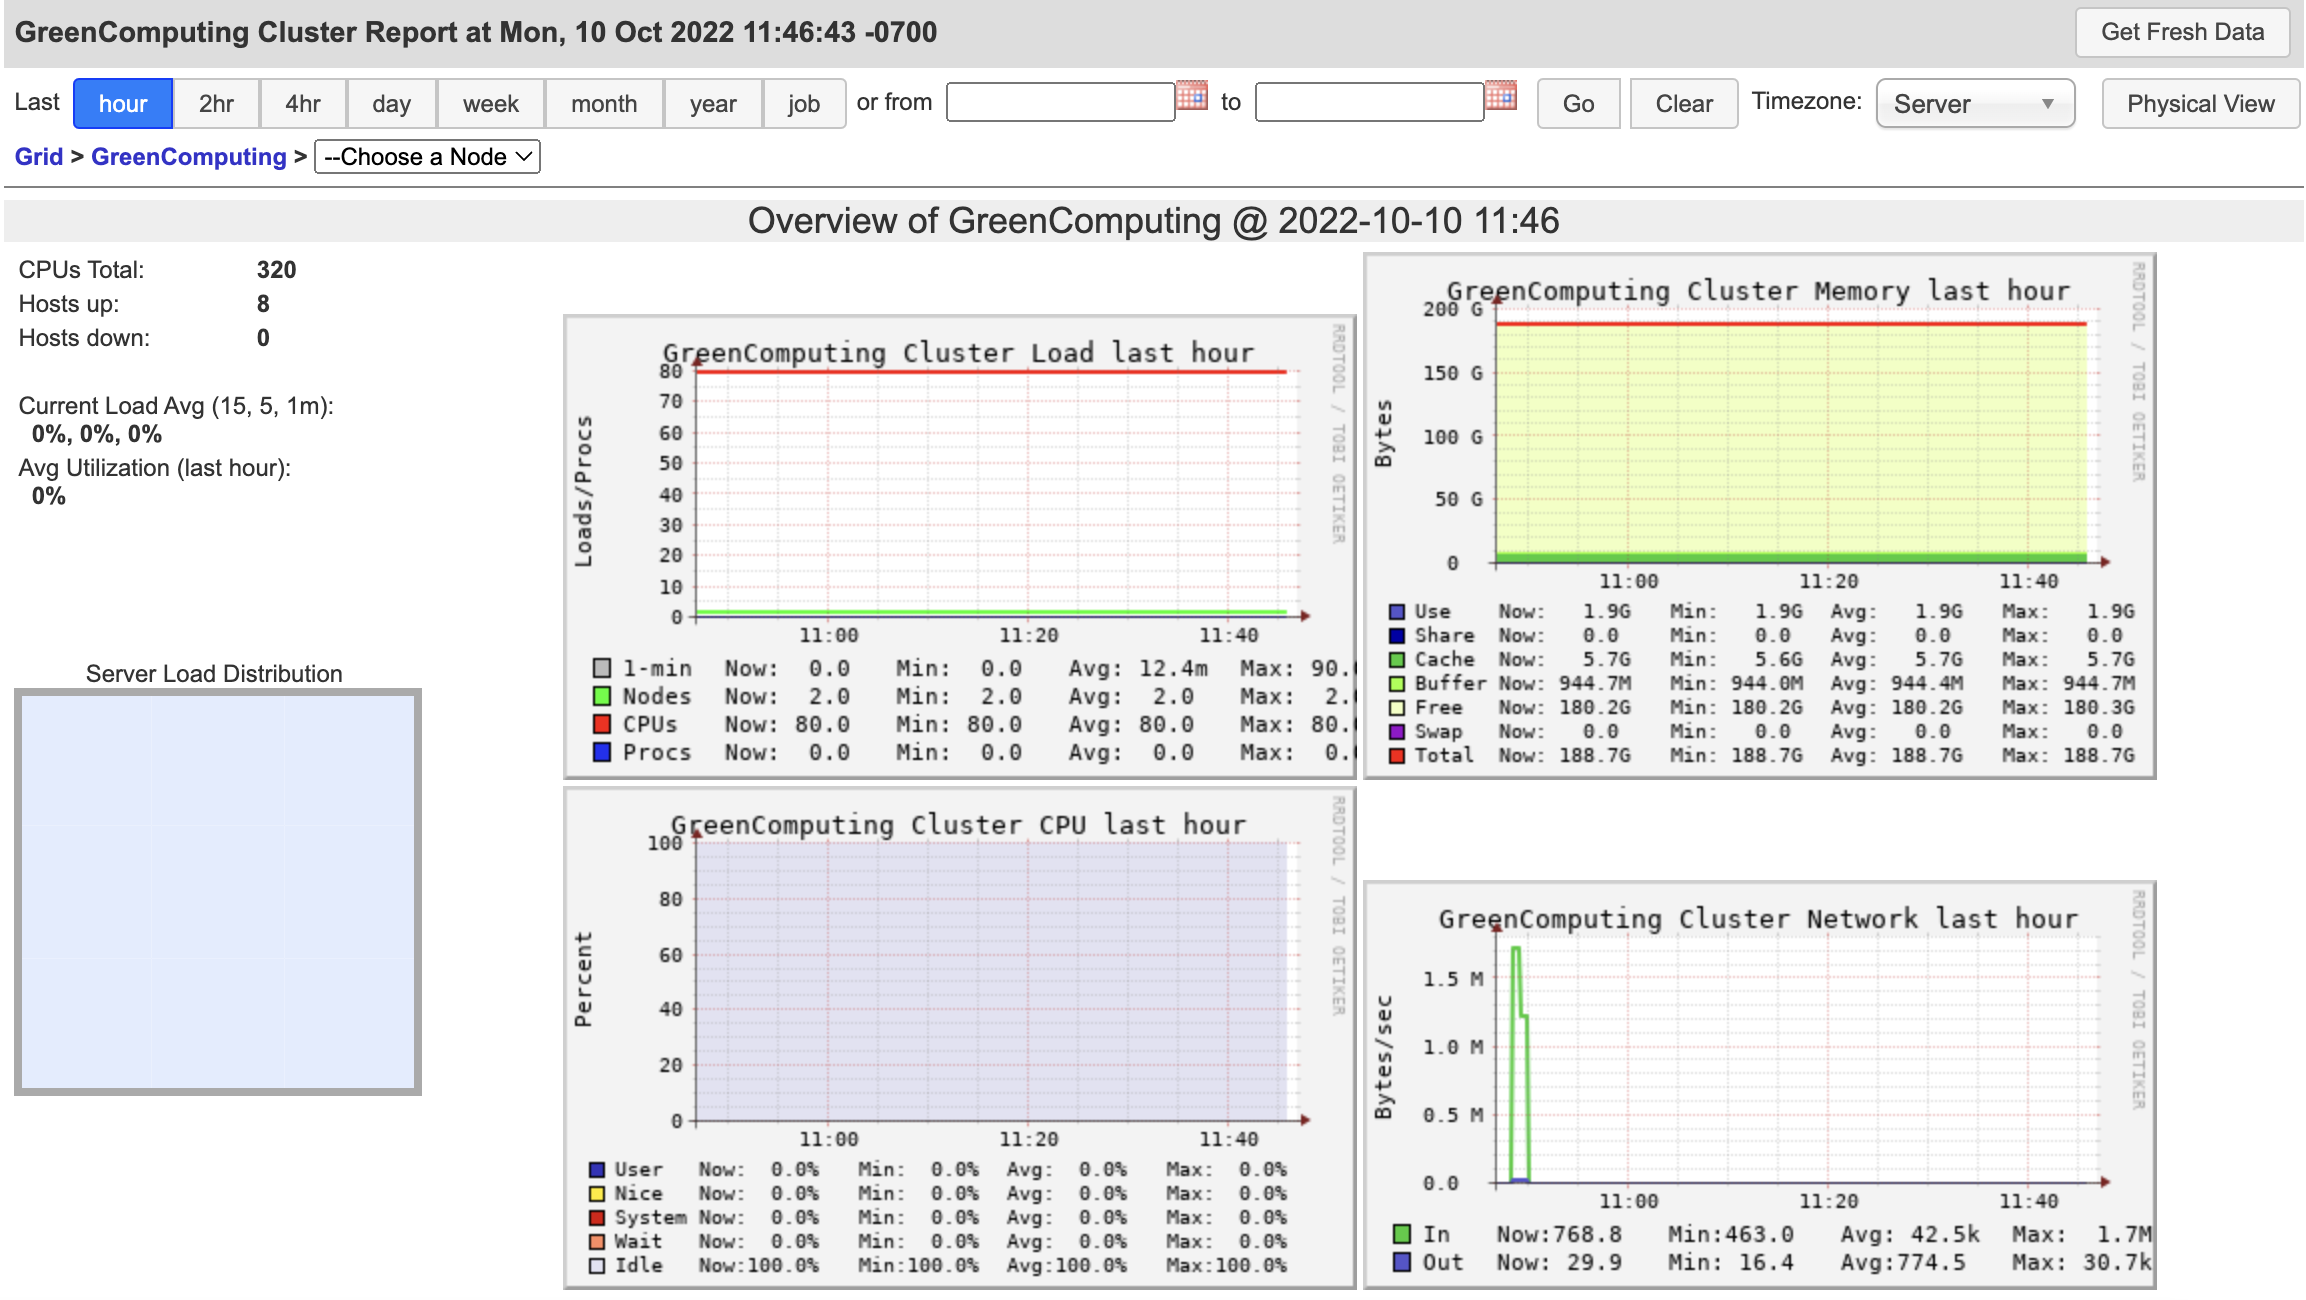 |
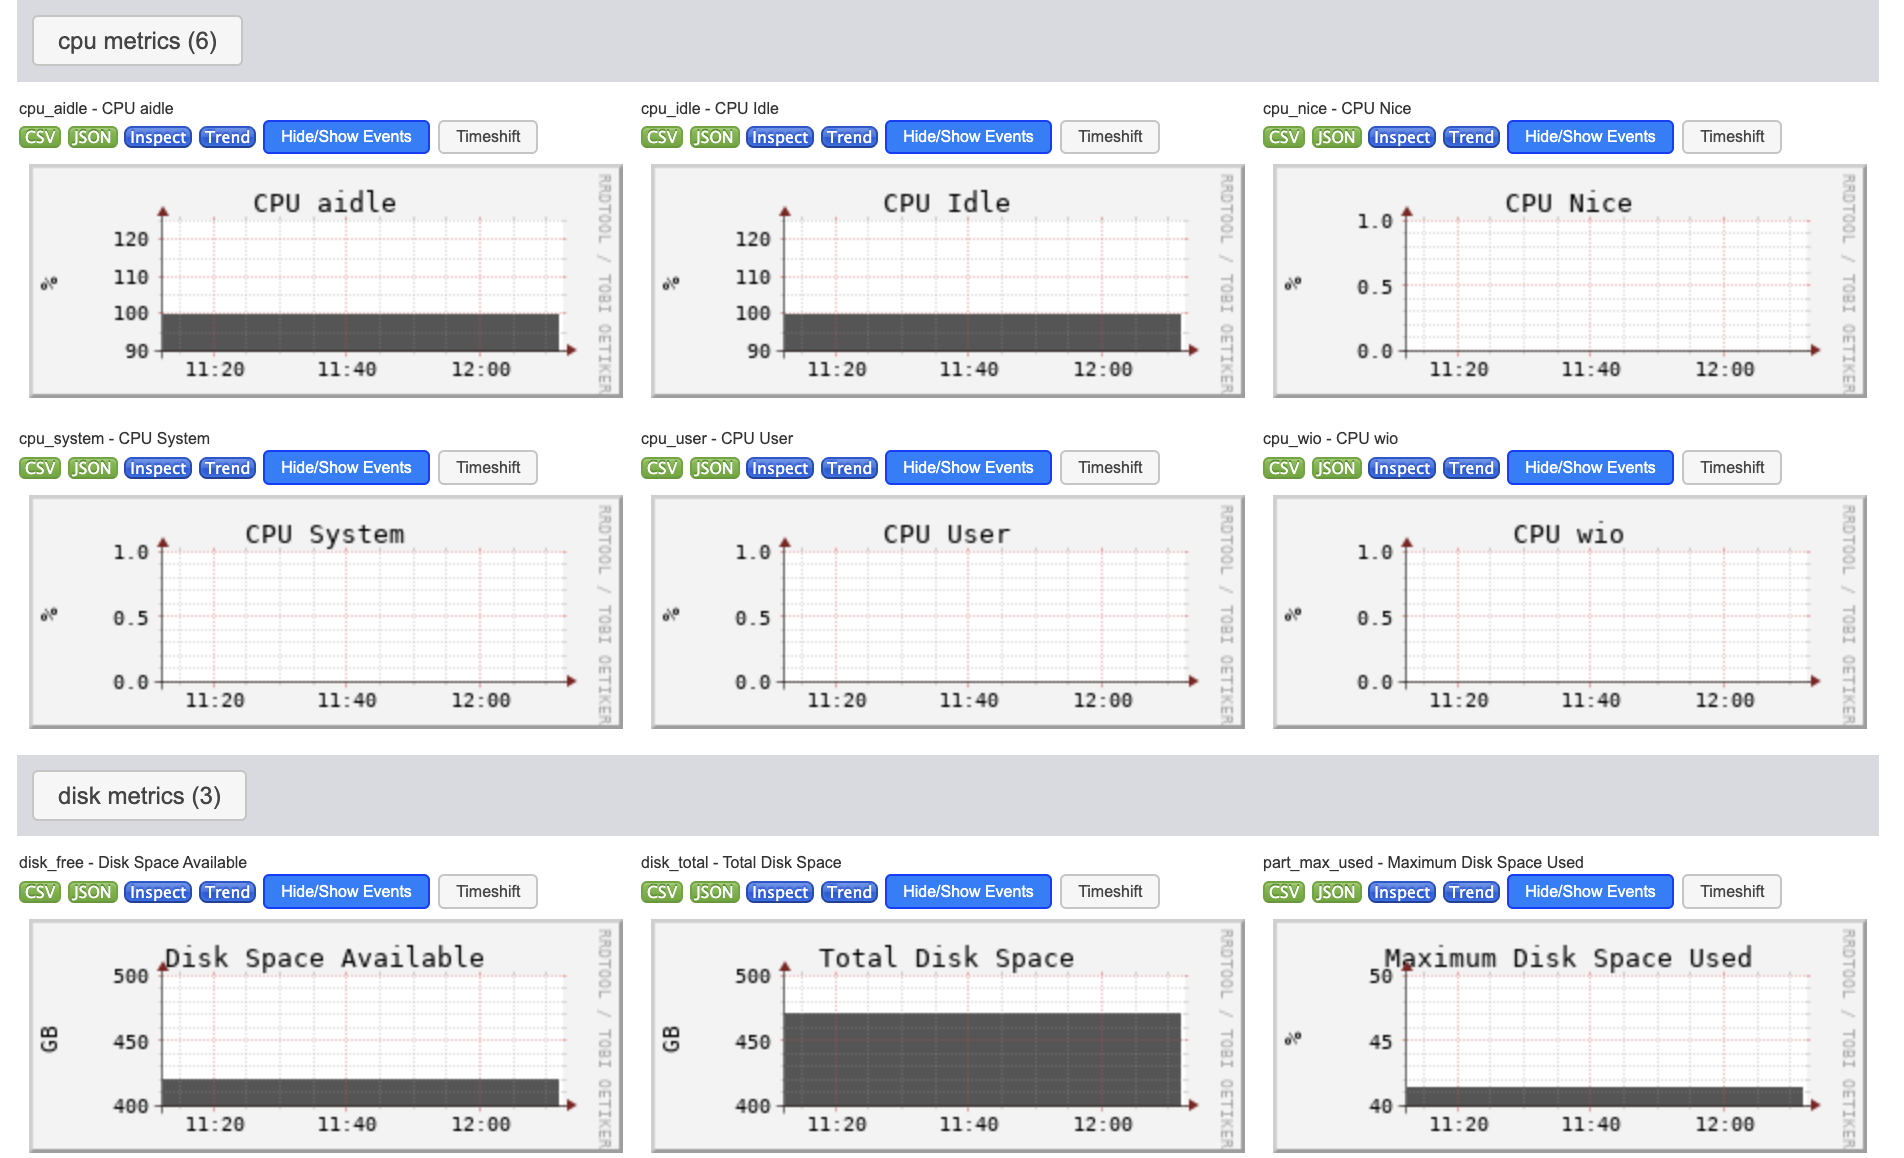 |
| Figure 1. The Ganglia System installed on our GreenComputing Cluster. | Figure 2. CPU and disk metrics visualized by Ganglia. |
 |
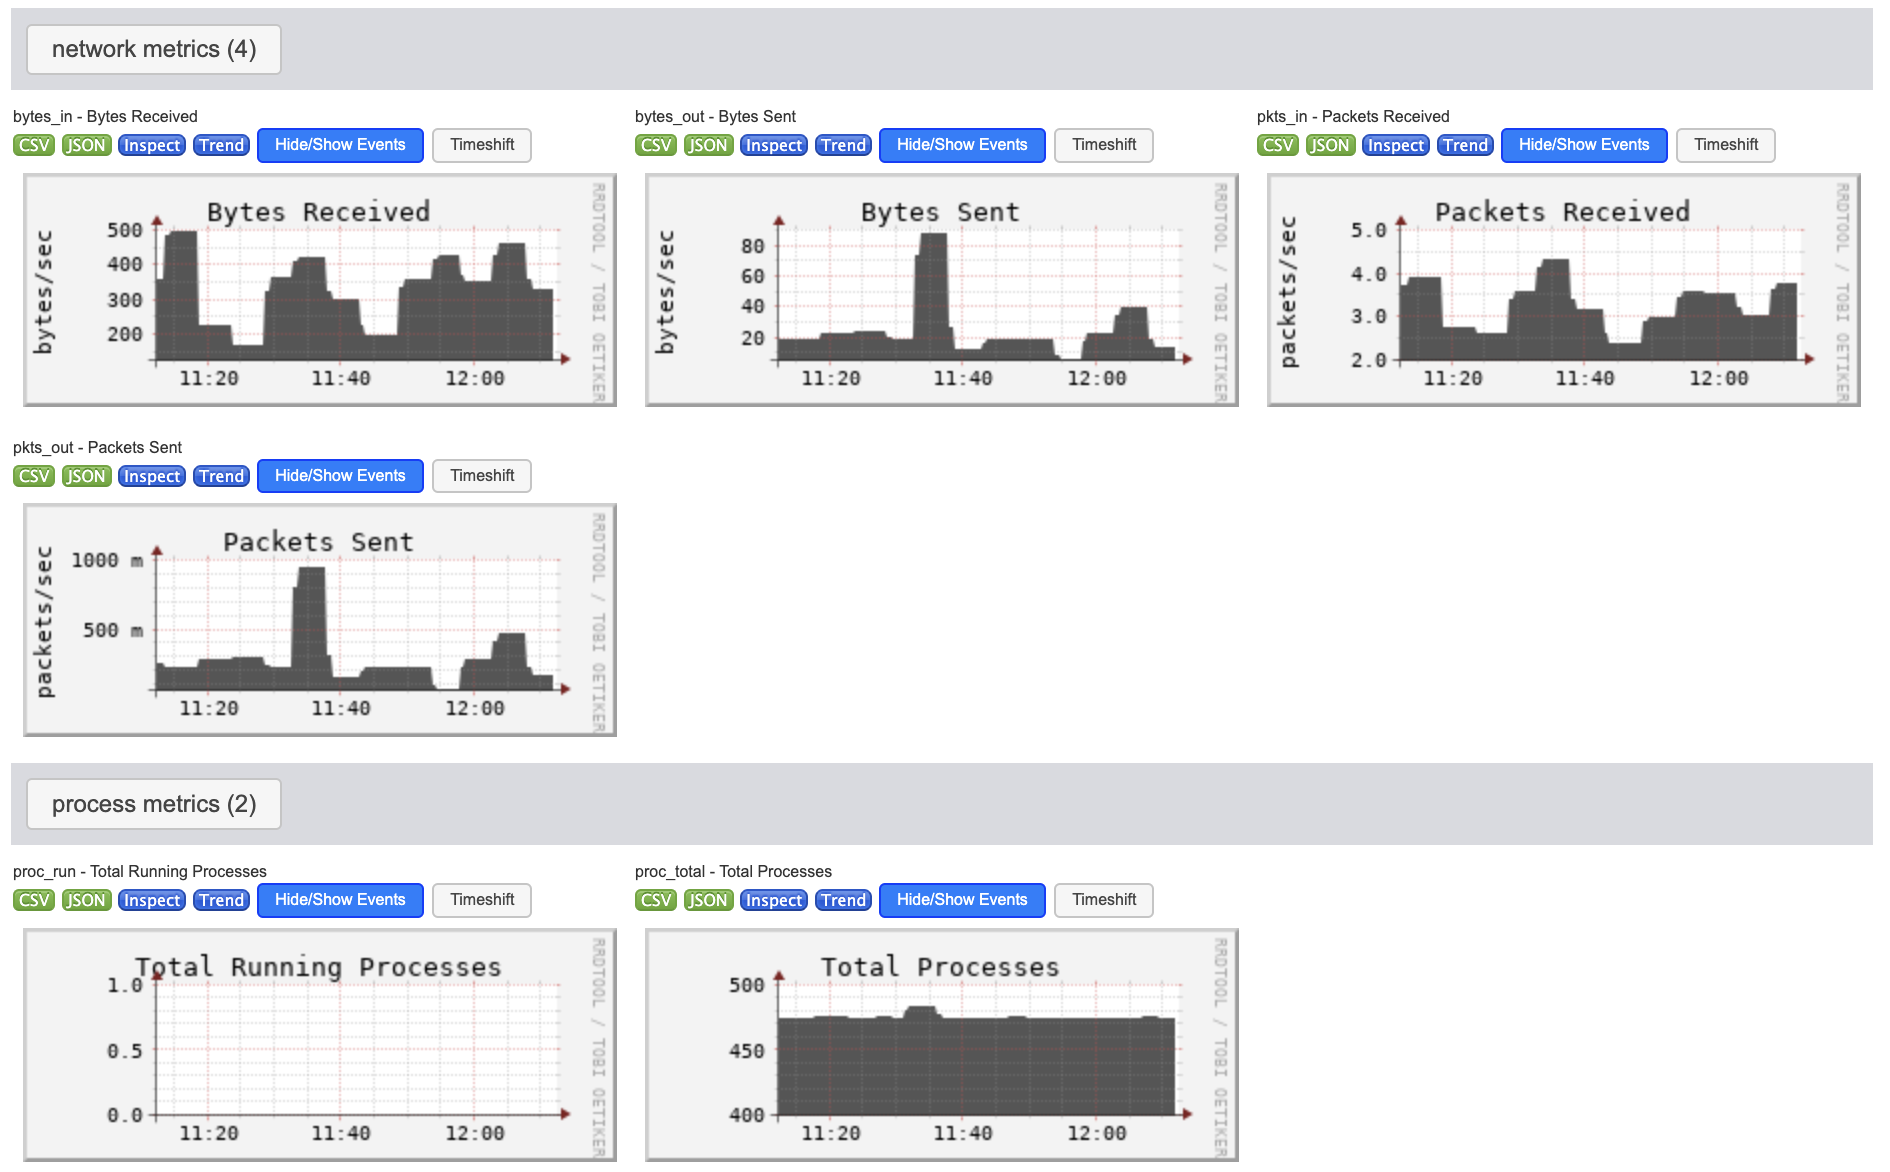 |
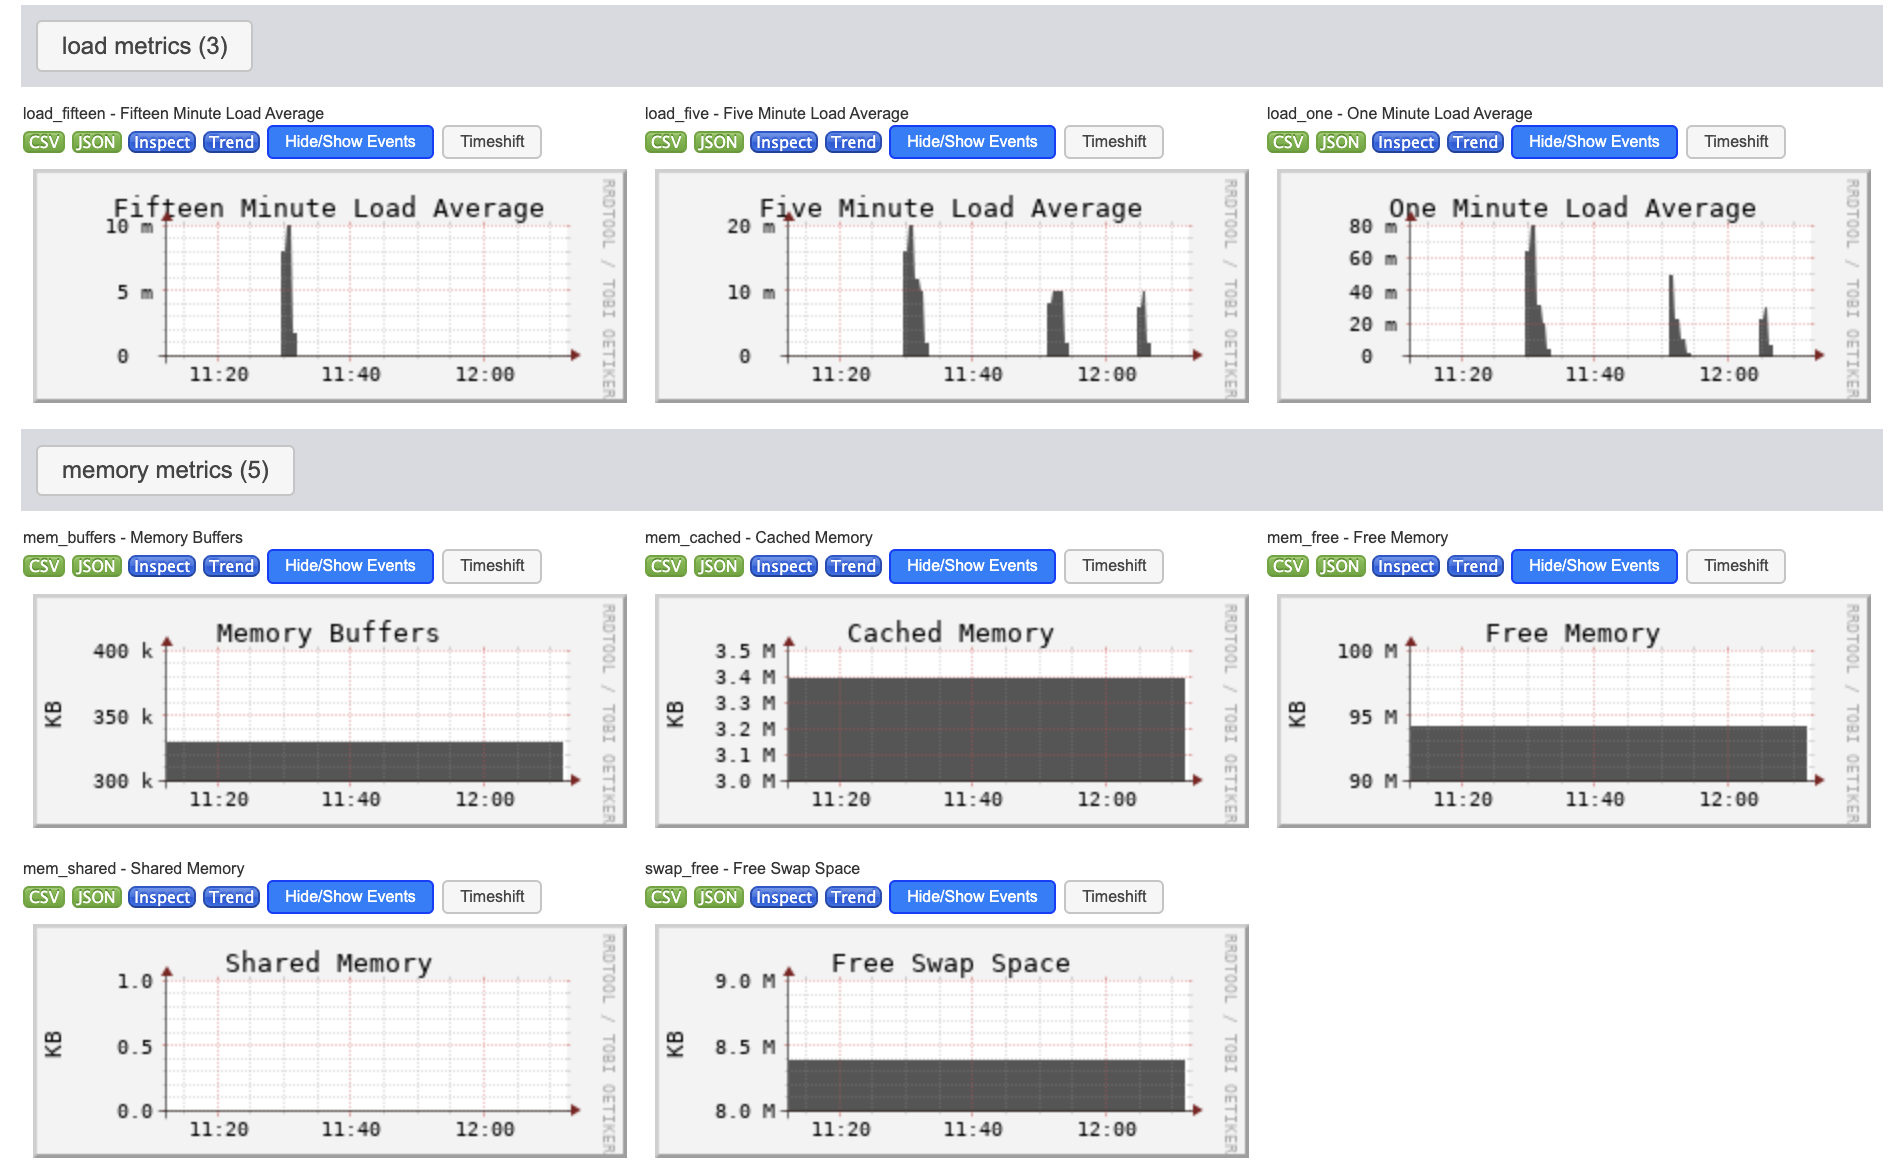
| Figure 3. Load and memory metrics visualized by Ganglia. | Figure 4. Network and process metrics visualized by Ganglia. |
Conclusion and Future Work
In conclusion, even though Ganglia is one of the oldest monitoring systems for clusters and grids, it is still a viable tool for cluster administrators. Through the research we saw that Ganglia has many custom metrics that can be added, it’s easy to install and its user interface is highly customizable and interactive. For example, we were able to add minutes to the ranges tab on the ganglia website by editing a PHP file. However, depending on the needs of the user/administrator it may be better to go with a newer monitoring system such as Munin or dataDog. Systems such as them are more adequate to handle containerized software which is highly used nowadays. As well as providing better security, alerting mechanisms, ease of access, creation of plug-ins and more.
Reference
[1] Massie, Matthew L., Brent N. Chun, and David E. Culler. "The ganglia distributed monitoring system: design, implementation, and experience." Parallel Computing 30, no. 7 (2004): 817-840.
[2] Massie, Matt, Bernard Li, Brad Nicholes, Vladimir Vuksan, Robert Alexander, Jeff Buchbinder, Frederiko Costa et al. Monitoring with Ganglia: tracking dynamic host and application metrics at scale. " O'Reilly Media, Inc.", 2012.
[3] Bhatnagar, Rakesh, and Jayesh Patel. "Performance Analysis of a Grid Monitoring System-Ganglia." International Journal of Emerging Technology and Advanced Engineering 3, no. 8 (2013): 362-365.
[4] Li, Min, and Yisheng Zhang. "Hpc cluster monitoring system architecture design and implementation." In 2009 Second International Conference on Intelligent Computation Technology and Automation, vol. 2, pp. 325-327. IEEE, 2009.
[5] Sun, Yongzhong, Kejiang Ye, and Cheng-Zhong Xu. "PLMSys: A Cloud Monitoring System Based on Cluster Performance and Container Logs." In International Conference on Cloud Computing, pp. 111-125. Springer, Cham, 2020.
Acknowledgements
Supported by The Louis Stokes Alliance for Minority Participation--LSAMP Program and funded by the National Science Foundation and the California State University System.