 Data centers consume about 1% of worldwide electricity. The most recent studies show that the electricity consumption in data centers is still increasing. There is an urgent need for reducing the energy consumption of data centers. Maintaining large amounts of data and providing powerful computing services require data centers to effectively distribute the workload. In this research, we studied several energy-efficient workload management strategies for data centers and compared the energy consumptions of applying these strategies to manage the same workload on the GreenCloud[1] simulator, a packet level simulator of energy-aware cloud computing data centers.

Experimental Results
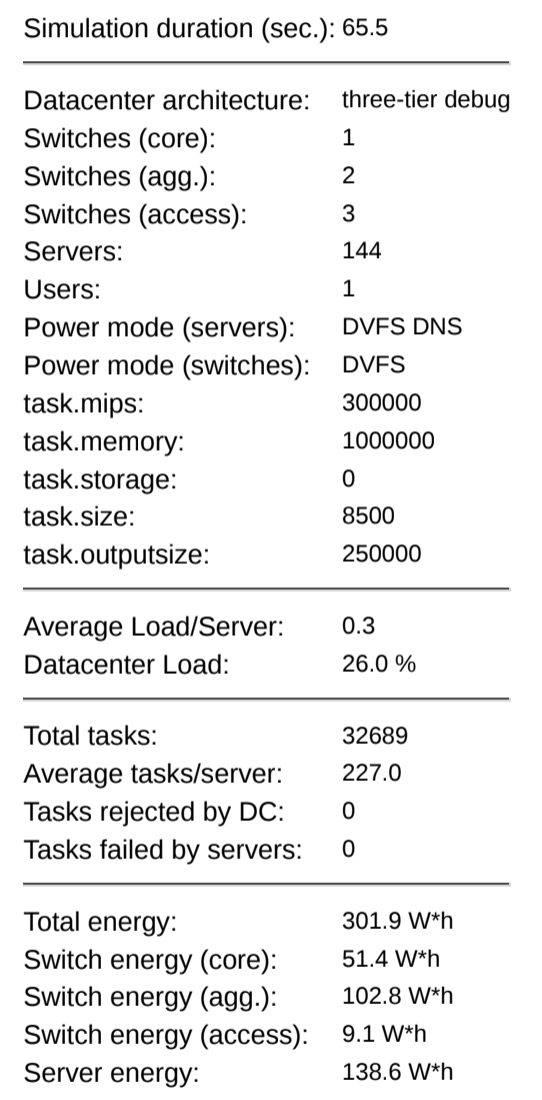
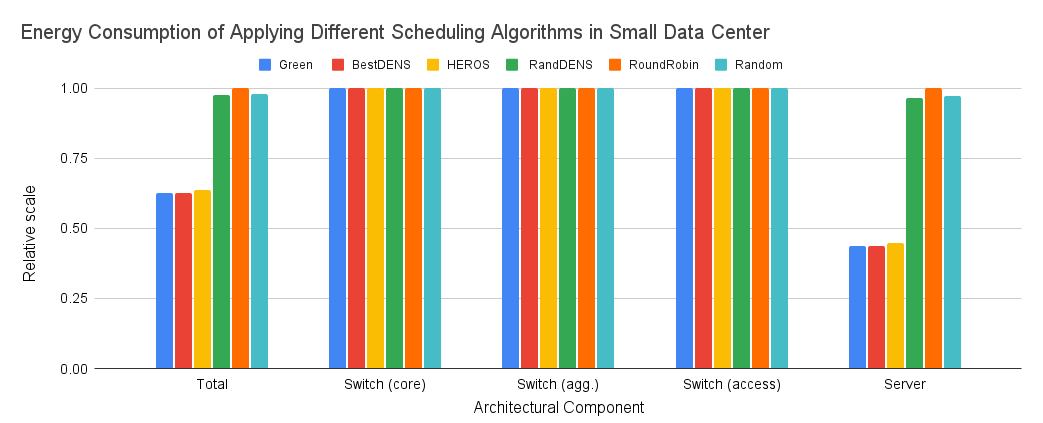
We simulated a small three-tier data center with three racks, each containing 48 servers (144 computer servers in total). We conducted experiments using the six workload scheduling algorithms and compared the energy consumption of the data center under the same workload. The total energy cost of a data center could be expressed as PTotal= Pswitches + Pservers, where Pswitches is the energy consumed by switches[4] and Pservers is the energy cost of all servers in data center.
 |
 |
| Figure 2. Simulation Output Example. | Figure 3. Relative Energy Consumption Comparison. |
Figure 2 shows the output of an experiment with the configuration of the data center and the workload generated in the experiment. Figure 3 displays the energy consumption of different scheduling algorithms. The Green, BestDEN, and HERO scheduling algorithms consumed nearly 37% less energy than the other 3 algorithms due to less power consumption by the servers.

Figure 4. Server Load Distribution by Different Scheduling Algorithms.
Figure 4 shows the server workload distribution in the data center. For the Random and RandDENS algorithms, all servers had a load fluctuating between 27% and 32%. The RoundRobin algorithm distributed the workload evenly across all servers with a server load of 26%. The other three algorithms utilized a small set of servers with high load up to 92%. Green and BestDENS scheduling algorithms used only 30% of the total servers whereas HEROS used about 39%. The Green and the BestDENS scheduling algorithms have nearly identical data in terms of server load per server.
(Figures created by David Macoto Ward.)
Conclusion and Future Work
We studied several thermal-aware workload balancing strategies that were focus on reducing energy cost of data centers through reducing the cooling cost of computing devices. Our research focus on the total energy cost of a cluster system, which including not only the cooling cost but also the electrical power consumption. We generated models for estimating the energy consumption based on utilization of two types of CPU-intensive workloads and validate our models with real measurements. Our experimental results show that our energy model for CPU-intensive workload has a high accuracy with the R2 is larger than 0.98. We developed a workload manage system with a workload manager that controls the workload distributions among the computing nodes on our cluster. We implemented the coolest-inlet, coolest-outlet and uniform distribution strategies and investigated the total energy consumption of our cluster using these three strategies with the same workload was submitted to our cluster. According to our experimental results, applying the coolest-inlet and coolest-outlet strategies consumed less energy than applying the uniform distribution strategy.
Reference
[1] D. Kliazovich, P. Bouvry, and S. U. Khan, “GreenCloud: A packet-level simulator of energy-aware cloud computing data centers,” IEEE Globecom 2010, vol. 62, no. 3, pp. 1263–1283, 2012, doi: 10.1007/s11227-010-0504-1.
[2] D. Kliazovich, P. Bouvry, and S. U. Khan, “DENS: Data center energy-efficient network-aware scheduling,” Cluster Comput., vol. 16, no. 1, pp. 65–75, 2013, doi: 10.1007/s10586-011-0177-4.
[3] Guzek, M., Kliazovich, D., & Bouvry, P. (2015). HEROS: Energy-Efficient Load Balancing for Heterogeneous Data Centers. Proceedings - 2015 IEEE 8th International Conference on Cloud Computing, CLOUD 2015, 742–749. https://doi.org/10.1109/CLOUD.2015.103.
[4] P. Mahadevan, P. Sharma, S. Banerjee, and P. Ranganathan, “A Power Benchmarking Framework for Network Devices,” IFIP-TC 6 Networking Conference, Aachen, Germany, May, 2009.
[5] Hovsepian, P., & Tian, Y. (2020). Energy Consumption Analysis of Scheduling Algorithms for Cloud Computing Systems. 2020 10th Annual Computing and Communication Workshop and Conference, CCWC 2020, 134–141. https://doi.org/10.1109/CCWC47524.2020.9031113.
Acknowledgements
Supported by The Louis Stokes Alliance for Minority Participation--LSAMP Program and funded by the National Science Foundation and the California State University System.