MATH 450
Advanced Mathematics for Engineers I
Winter 2007
General Information:
I teach section 1 of Math 450. The times and locations for lecture and office hours are:
Lecture: TTh 8.30 - 10.30 at 2315 GGBL
Office Hours:
TTh 10.30 - 11.30 at 2705 CSE building
-
W 11 - 12 at East Hall 4851
Course Documentation and Handouts:
general course information (.pdf)
syllabus (.pdf)
review sheet for midterm (.pdf)
a review sheet for the final (.pdf)
another review sheet for the final (.pdf)
general course information (.pdf)
syllabus (.pdf)
review sheet for midterm (.pdf)
a review sheet for the final (.pdf)
another review sheet for the final (.pdf)
Homework:
homework 1 (.pdf)
homework 2 (.pdf)
homework 3 (.pdf)
homework 4 (.pdf)
homework 5 (.pdf)
homework 6 (.pdf)
homework 7 (.pdf)
homework 8 (.pdf)
homework 9 (.pdf)
homework 10 (.pdf)
homework 11 (.pdf)
Announcements:
A review session for the final exam will be held on Thursday April 19 from 9.00 to 11.00 at GGBL 2315.
A second review session for the final exam will be held on Sunday April 22 from 9.00 to 11.00 at Mason Hall 1436.
I will also hold extra office hours next week. I will announce the times during lecture.
The final exam will be held on Monday April 23 from 10.30 to 12.30 at our regular lecture room (GGBL 2315). Calculators are not allowed in this exam, but you can bring two pages (i.e., the two sides of a 11 x 8.5 in piece of paper) of notes. These review sheets 1 2should help you prepare for the exam.
The midterm exam will take place on Thursday Feb. 22 from 8.30 to 10.30 a.m. at GGBL 2315. Calculators are not allowed in this exam, but you can bring one page (i.e., one side of a 11 x 8.5 in piece of paper) of notes. This review sheet should help you prepare for the exam.
A review session for the midterm will be held on Mon. Feb. 19 from 3 to 5 at DENN 245.
Examples:
Additional Problem #1 in Homework #5
While calculating the solution of the wave equation with the given initial conditions by hand is quite involved, doing so in a computer is rather straight forward. These two Matlab files, wave.m and F.m generate the solution using d'Alembert's formula. Here are some notes:
-
The first file, wave.m, describes the solution as u(x, t) = F(x - ct) + G(x + ct) (taking into account that F(x) = - G(x) and taking h = c = 1), and generates the plot of the solution at time intervals Δ t = 0.05 form t = 0 to t = 10
-
The second file, F.m, describes F(x) as the area under the graph of g( ξ ) between ξ = 0 and ξ = x divided by -2c (with g given by the initial conditions, ut(x, 0) = g(x))
If you are wondering what to do with these files, here are some suggestions:
-
You can download both files into a common directory, then open Matlab, set the work path to the directory where you saved them, and type wave at the MATLAB command prompt. This will generate an animation of the solution
You can also change the values of h and c and observe what happens to the amplitud and speed of propagation of the wave
-
Alternatively, you can just click in the image below to see an animation
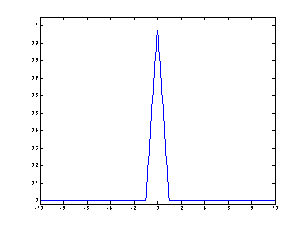
Initial conditions. Click on the image to see an animation from t =0 to t = 10
-
Another wave equation example
Matlab files: wave.m and F2.m generate the solution using d'Alembert's formula.
Initial conditions. Click on the image to see an animation from t =0 to t = 10
Another wave equation example
Matlab files: wave.m and F3.m generate the solution using d'Alembert's formula.
Initial conditions. Click on the image to see an animation from t =0 to t = 10


