Analyzing Beats and Interference With Probeware
|
| Author(s): George Lyle |
Probeware
/ Instrumentation
SED 695B; Fall 2005 |
Research Question:
How do sound waves interefere to form beats? |
|
Standards addressed:
California Physics Standards:
4. Waves have characteristic properties that do not depend on the type of wave. As a basis for understanding this concept:
f. |
Students know how to identify the characteristic properties of waves: interference (beats), diffraction, refraction, Doppler effect, and polarization. |
|
Independent variable |
Dependent variables |
Controls |
Series |
| Mass on tuning fork |
Frequency |
|
|
Materials |
Procedures |
- Pasco 750 interface with SCSI input to computer.
- Sound Sensor
- Two tuning forks mounted on resonance boxes.
- Paper clips bent to fasten to top of forks to change frequency.
|
- Prepare the tuning forks by attaching one or two large paper clips to the top of one fork.
- Plug the sound sensor into port A of the Pasco 750 interface.
- Place the sound sensor near the resonance boxes, with both boxes pointing at the sensor.
- Continue following the instructions accompanying the pictures below
|
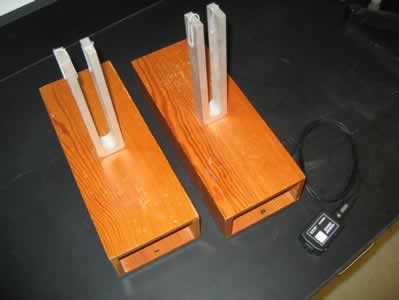
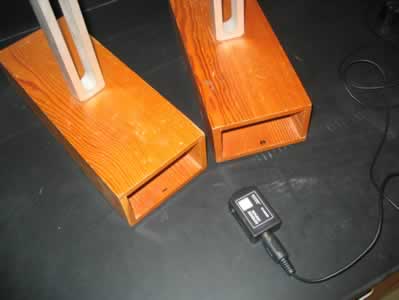
| |
|
This is the equipment needed. Not shown is the Pasco 750 interface. |
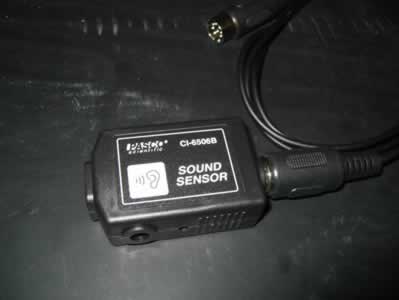
|
This is the older Pasco sound sensor. It functions as a microphone. Newer sensors act as sound level measuring devices and don't seem to have the rapid response needed for this task. |
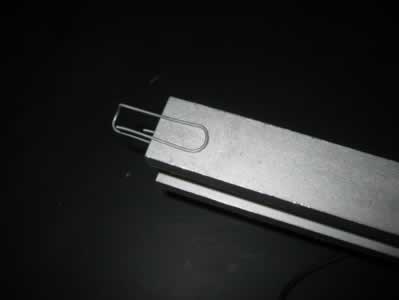
|
Reshape a paper clip to add a bit of mass to one of the two tuning forks. |
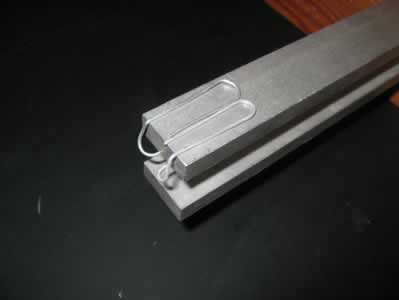
|
You can put two clips on the fork to get an even greater difference in frequency. |
|
This is how you position the sound sensor. It is best to keep it close and equidistant from the two resonance boxes. |
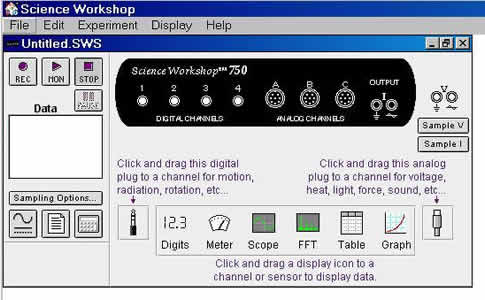
| |
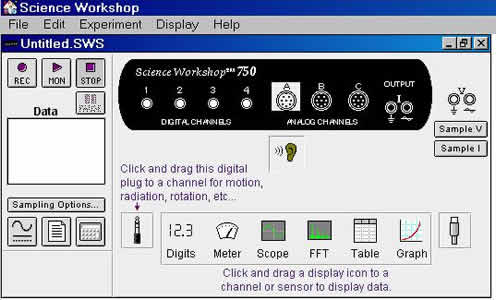
This is the Science Workshop introductions screen. Click on the analog plug at lower right and drag it to Channel "A" |
|
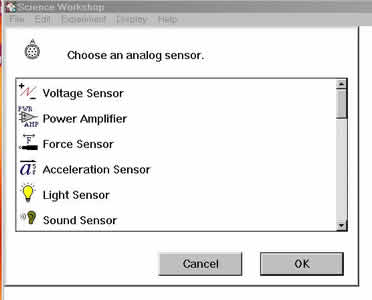
The following screen appears. |
|
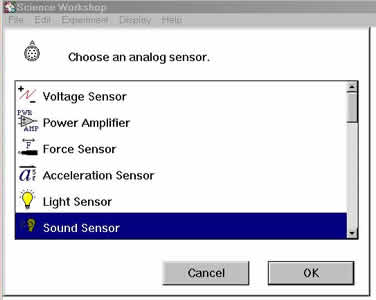
Select the Sound Sensor and click OK |
|
The sound sensor icon appears below the "A" input.
Now drag the "Scope" icon to the "A" input |
|
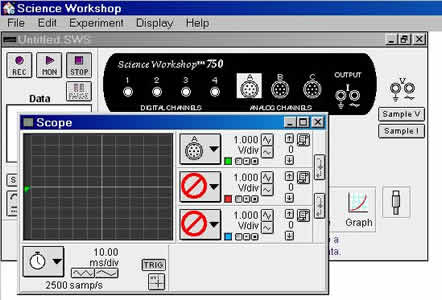
A small oscilloscope display appears. |
|
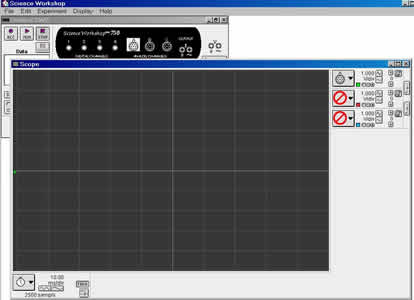
Enlarge the Oscilloscope window. |
|
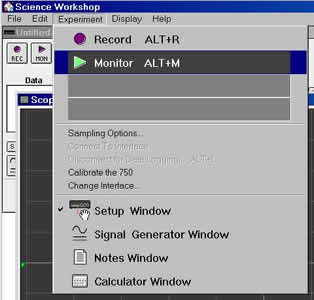
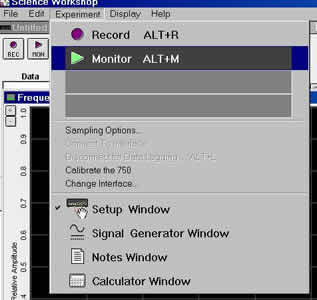
Click on Experiment, then click on Monitor on the menu that appears. |
|
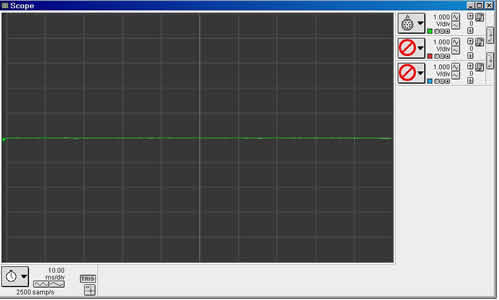
An oscilloscope trace appears across the middle of the display. |
|
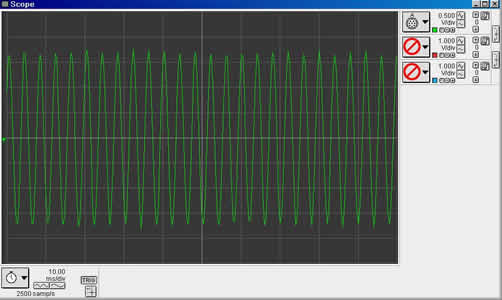
Strike one of the tuning forks near the microphone. A waveform appears. If the waveform is too tall or too short, adjust it with the buttons in the upper right corner of the display. |
|
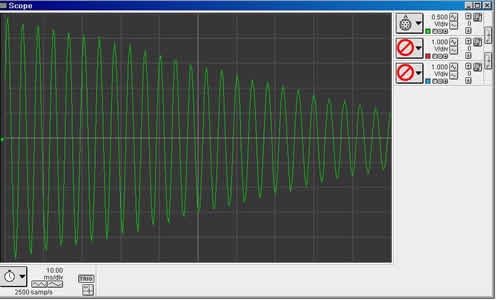
If you strike the weighted and unweighted tuning fork simultaneously, you will see constructive and destructive interference on the oscilloscope. |
|
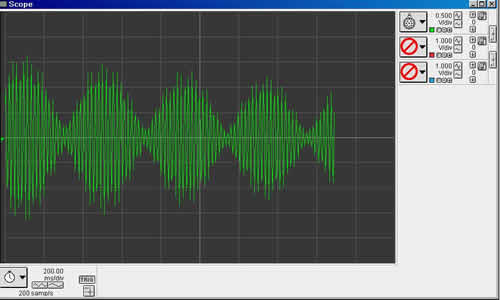
If you slow down the sweep rate with the buttons at lower left, the interference is much more apparent. |
|
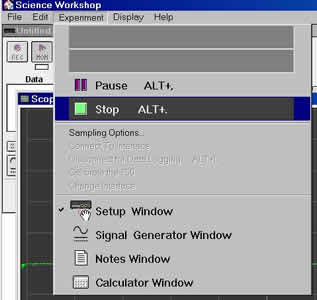
Click on Experiment and use the menu that appears to stop collection of data by clicking Stop. |
|
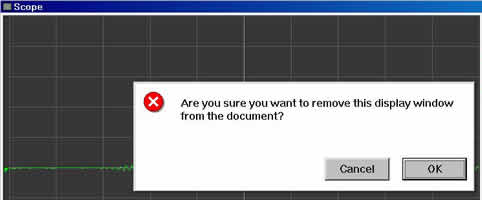
Close the oscilloscope window, clicking OK to confirm that you really want to do this. |
|
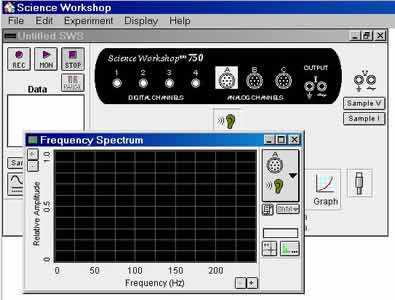
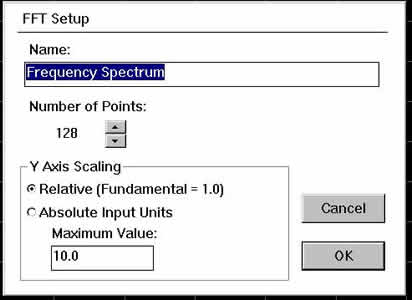
Drag the FFT icon to input "A". A small Frequency Spectrum display appears. |
|
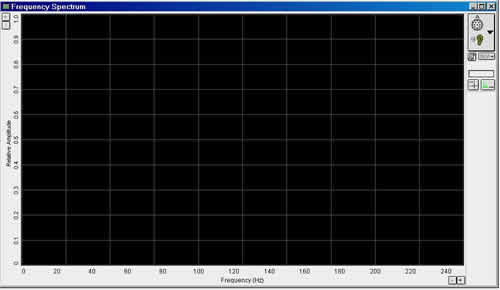
Enlarge the Frequency Spectrum Display |
|
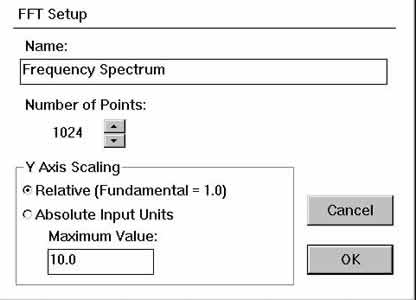
Double-click on the horizontal axis and increase the number of points to 1024. This allows more accuracy at the expense of a slower refresh rate. |
|
Here you can see the larger number of points. |
|
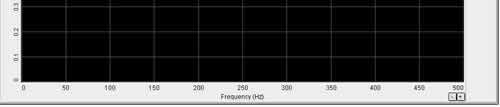
Use the buttons at lower right to increase the maximum frequency to 500Hz. |
|
Click on Experiment and select Monitor from the menu that appears. |
|
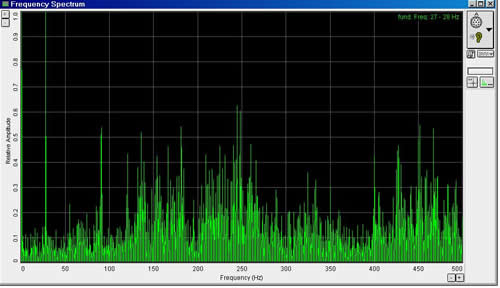
Here you see ambient noise displayed. |
|
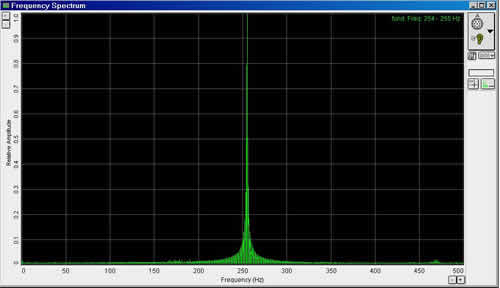
Strike one tuning fork and you will see a sharp spike. The frequency appears at upper right. |
|
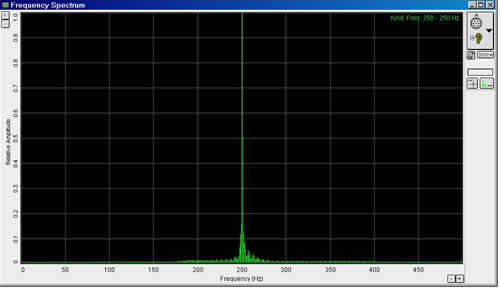
Strike the weighted tuning fork and notice that the frequency is slightly different. |
|
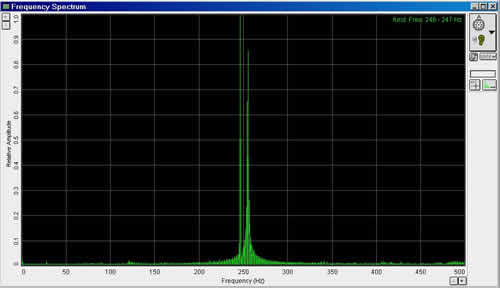
Strike both tuning forks and you will see two peaks if their loudness is the same. |
|
Here is a display with a greater difference between the tuning fork frequency. |
| |
|
References & Links:
The manufacturer of the probeware.
An online Tutorial concerning interference and beats.
An Excel spreadsheet illustrating beats.
A Java Applet illustrating beats.
|