SED 695B; Fall 2005
Research Question:
We only add water and soil to a growing plant, where does plant mass come from? First we will investigate water, then we will investigate the soil.
Standards addressed:
SEVENTH GRADE LIFE SCIENCE
Cell Biology
1. d. students know that chloroplasts capture sunlight energy for photosynthesis.
BIOLOGY
Cell Biology
1. f. students know usable energy is captured from sunlight by chloroplasts and is stored through the synthesis of sugar from carbon dioxide.
________Time_______________________Plant Mass________ _ ________Amount of Water ____________Amount of Soil
Cup with Soil and No Plant
1 cup with soil only

- WATER
come from water?
Procedures
-
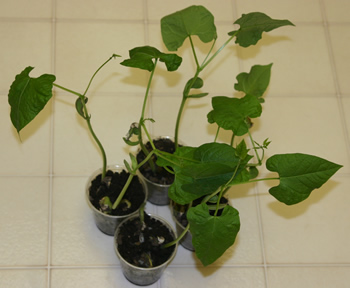
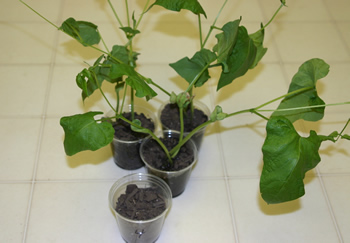
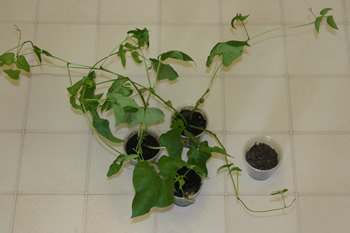
Begin with sprouted lima beans and moistened soil in 4 small cups
-
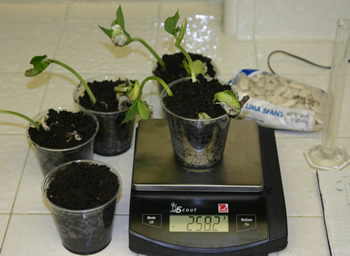
Mass cup, soil and sprouted seeds
-
Measure and add just enough water to moisten the soil
-
Add the same amount of water daily (10 ml = 10 grams)
-
Add the same amount of soil to 5th cup
-
Weigh and record the mass of each cup daily.
-
Record the amount (volume/mass) of water added.
DATA COLLECTION
Cup Number |
Day |
Mass in Grams |
Cup Number |
Day |
Mass in Grams |
Cup Number |
Day |
Mass in Grams |
1 |
1 |
259.8 |
2 |
1 |
259.7 |
3 |
1 |
259.4 |
Plant |
2 |
253.6 |
Plant |
2 |
254.4 |
Plant |
2 |
251.5 |
3 |
249.3 |
3 |
250.0 |
3 |
245.9 |
|||
4 |
247.3 |
4 |
247.9 |
4 |
241.2 |
|||
5 |
245.4 |
5 |
245.2 |
5 |
237.0 |
|||
6 |
245.5 |
6 |
243.8 |
6 |
235.0 |
|||
7 |
235.3 |
7 |
235.8 |
7 |
225.6 |
|||
8 |
230.0 |
8 |
230.4 |
8 |
222.1 |
|||
4 |
1 |
259.3 |
5 |
1 |
259.6 |
|||
Plant |
2 |
249.1 |
Soil |
2 |
256.7 |
|||
3 |
241.3 |
Only |
3 |
254.9 |
||||
4 |
235.9 |
4 |
254.7 |
|||||
5 |
230.0 |
5 |
253.4 |
|||||
6 |
227.3 |
6 |
254.0 |
|||||
7 |
216.7 |
7 |
249.8 |
|||||
8 |
212.6 |
8 |
247.7 |
What does the Data indicate?
What was not being controlled?
-
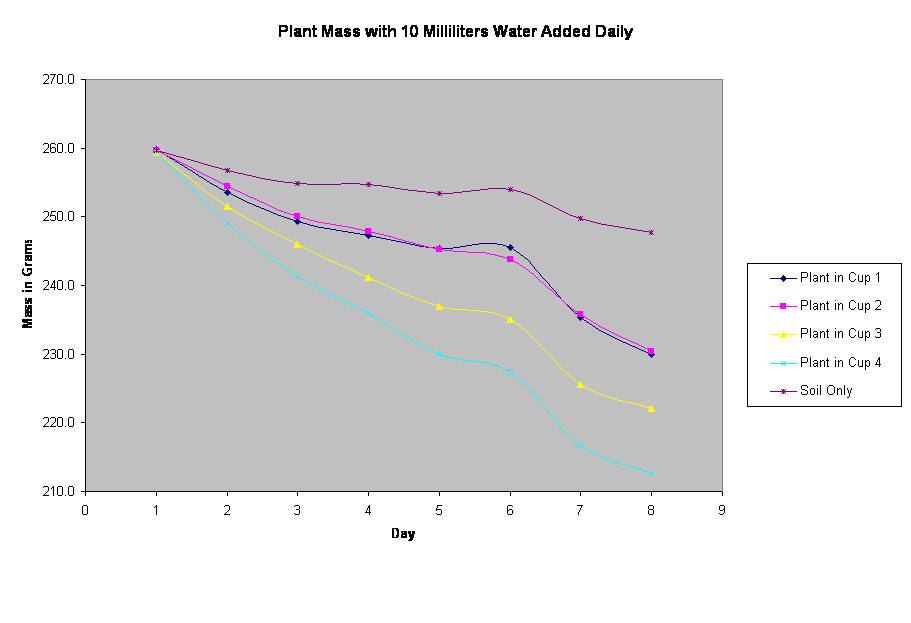
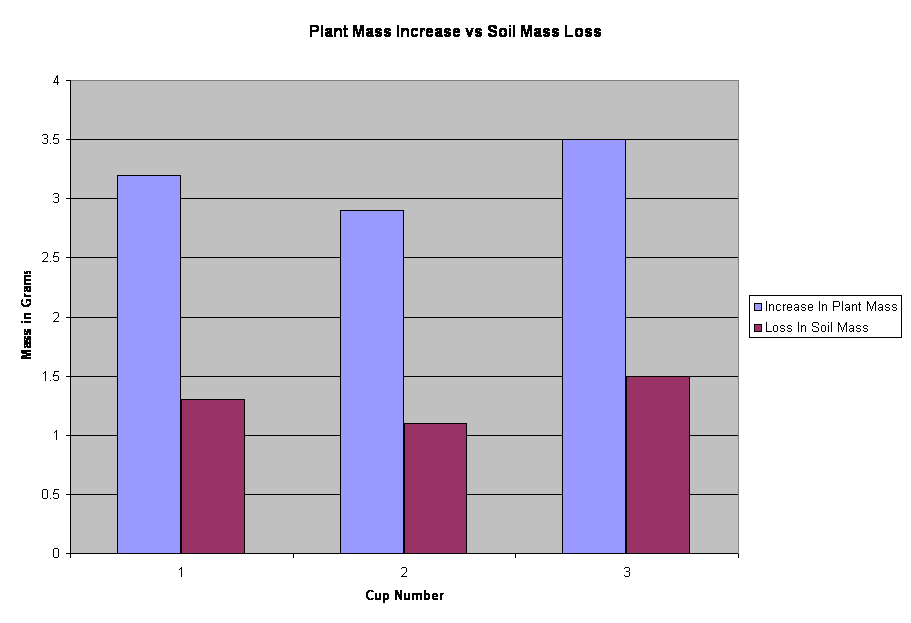
From the above graph of the data, one can see that all of the plants lost mass even as 10 milliliters (or grams) of water were added daily.
-
The total amount of water added over 8 days was 80 grams.
-
The mass of water being lost by the plant through transpiration was faster than the mass that was being gained by the plants through growth.
-
The inability to measure how much water that was lost by the plant through transpiration is a problem beyond the scope of this experiment.
-
The control (Cup #5) indicates that the water lost from the soil through evaporation was much less than the water lost by the plants through transpiration.
-
Total mass lost from the control cup was 11.6 grams in 8 days.
-
The average mass lost from all of the plants was 35.8 grams in 8 days.
CONCLUSION PART ONE
- The results were therefore inconclusive as to whether or not plant mass comes from water. It appears that water does not influence plant mass increase over the short term of growth.
PART TWO - THE SOIL
Does plant mass come from the soil?
Materials
|
Procedure
|

DAY 1_____________________________________DAY 14
DATA COLLECTION DAY 1
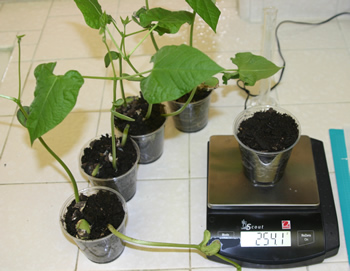
Cup 1 = 9.2 g |
Cup 2 = 8.4 g |
Cup 3 = 8.8 g |
Cup 4 = 8.4 g |
Plant 1 = 23.7 g |
Plant 2 = 26.8 g |
Plant 3 = 24.6 g |
|
Soil 1 = 84.9 g |
Soil 2 = 76.5 g |
Soil 3 = 77.8 g |
Soil 4 = 80.6 g |
DATA COLLECTION DAY 14
Cup 1 = 9.2 g |
Cup 2 = 8.4 g |
Cup 3 = 8.8 g |
Cup 4 = 8.4 g |
Plant 1 = 26.9 g |
Plant 2 = 29.7 g |
Plant 3 = 28.1 g |
|
Soil 1 = 83.6 g |
Soil 2 = 75.4 g |
Soil 3 = 76.3 g |
Soil 4 = 80.6 g |
Change in Plant Mass = |
Change in Plant Mass = 2.9 g |
Change in Plant Mass = 3.5 g |
|
| Change in Soil Mass = 1.3g |
Change in Soil Mass = 1.1g |
Change in Soil Mass = 1.5g |
No Change |
ANALYSIS PART TWO
-
From the graph of the above data one can see that the increase in plant mass was more than the mass lost by the soil.
-
The average increase in plant mass over 14 days was 3.2 grams.
-
The average mass lost by the soil was 1.3 grams.
-
The average difference in plant mass increase and soil mass loss was 1.9 grams.
Therefore, where did the increase in plant mass come from?
Let's look at the equation for photosynthesis:
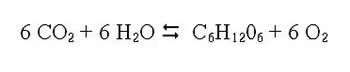
What are we missing?
CONCLUSION PART TWO
-
In the 17th century a Flemish physician, chemist, and physicist named Jan Baptista van Helmont performed a 5 year study in which he massed the soil of a willow tree in a pot and after 5 years found that the willow had gained a tremendous amount of mass and soil had lost very little. Van Helmont believed that water was the source of the plant mass.
-
As we tried to investigate water earlier, we were unable to prove that hypothesis. John Woodward, a professor and physician at Cambridge University in the late 17th century, tried to design an experiment to test the hypothesis that water was the source of the extra mass. In a series of experiments over 77 days, Woodward had seen the same results as this study and he also rejected the hypothesis that plant growth comes from water.
-
It wasn't until 1771 that an English chemist, Joseph Priestly, began to experiment with plants and the air. He made a major breakthrough which led us to the understanding that the plant mass actually does come from the air in the form of carbon dioxide. This fact was not confirmed until 1940 when Martin Kamen discovered carbon-14 which could be used to trace the carbon in carbon dioxide through photosynthesis.
References & Links:
The von_Helmont_problem
Experiments:
http://www2.nsta.org/Energy/find/primer/primer2_2.html
http://www2.nsta.org/Energy/find/primer/primer2_4.html
Scientists:
Von Helmont