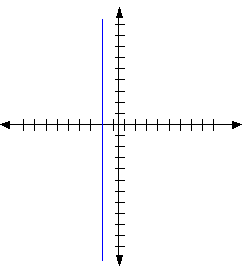
The graph of an equation with two variables represents all the possible combinations of x and y that satisfy the equation. In other words the points on the graph have coordinates (x, y) that make the statement of the equaion true. Depending of the nature of the equation and the exponents of the variables each equation has a different graph.
The graph of any equation that has two variables which that both have power one, are not being multiplied by each other and are not in the denominator of any fractions is a straight line.
For example, the graph of 2y - x + 4= 0 is a line. That means if we find all possible x and y combination that work in the equation and plot them in a coordinate system the result will be a line. Since two points determine a line, if we recognize an equation as a linear equation, we only need two sets of x's and y's (points) that satisfy the equation for the graph. There are many ways of finding these points and there are an infinite number of them. We will look at graphing lines using their x-intercepts and y-intercepts. These are the points where the line crosses the x-axis and the y-axis respectively. The reason we choose these points is because they are easier to work with. The x-intercept of a line is a point on the x-axis and therefore has y coordinate zero. And the y-intercept of a line is a point on the y-axis and has x coordinate zero. We are going to use these facts to find the missing coordiatae of each point.
We will first plug in zero for y and find the corresponding x and then plug in zero for x and find the corresponding y.
Example 1) Graph 2y - x + 4 = 0
If we plug in 0 for x, we get:
2y - 0 + 4 = 0 We subtract 4 from both sides:
2y = -4 and dividing by 2 we get y = -2, so we have (0,-2), this is the y-intercept.
Next we'll plug in zero for y:
2(0) - x + 4 = 0 We subtract 4 from both sides:
-x = -4 or x = 4, we get our second point (4,0), this is the x-intercept
Now we plot the points and connect them. The resulting line represents all the x,y combinations that work in the given equation.

Each line has a steepness which is referred to as the slope. The steepness of a line or its slope is the ratio of the rise of the line (how far up or down we have to go in order to reach another point) to its run (how far forward or backward we have to go). For the above line, the slope is 2/4 or 1/2, since we have to go up 2 units and then over 4 units to get from one point to the other. We can also find the slope by solving our equation for y first. Then the slope will be the coefficient of x (and the remaining number is the y-intercept):
First we'll add x to both sides and subtract 4: 2y = x - 4
Then we'll divide both sides by 2: y = x/2 - 2 (this is called the slope-intercept form of the line)
So the slope is 1/2 and the y-intercept is -2. This information maybe be useful in some cases.
Example 2) Graph 4y + 5x = 20
Plugging in zero for the x, we get:
4y = 20 or y = 5
So we get y-intercept (0,5)
Pluging in zero for the y, we get:
5x = 20 or x = 4
So the x-intercept is (4,0)

Notice that the slope of this line is -5/4, since we have to go down 5 units and forward 4 units to get from one point to the next.
And if we solve for y (change to slope-intercept form), we first have to subtract 5x from both sides:
4y = -5x + 20 and then divide by 4:
y = -5/4 x + 5
Which also shows the slope to be -5/4 and the y-intercept to be 5.
Special cases:
Sometimes we may want to graph equations with only one variable in the coordinate system.
For example y = 4 or x = -2 are equations that contain only one variable, but it is possible to graph them as lines.
In the case of y = 4, the set of points that satisfy the equation are all points that have y value 4 (with any possible x value). These points can be represented by a horizontal line at y = 4. In general the graph all equations of the form y = C, where C is a number, is a horizontal line at C.

In the case of x = -2, the graph is the set of all points with x value -2 which can be represented by a vertical line at -2. In general the graph of all equations of the form x = C is a vertical line at C.
